Welcome to the PICOT Research Question and Statistics page! This page will provide you with information
about how the PICOT research question informs upon the choice of statistical test in applied research.
Twenty-one (21) of the most popular statistical tests are presented and diagrams are used
to show how PICOT can be "mapped" onto that choice of statistical test. Click on
one of the links below to understand when that particular statistical test is chosen
to answer a research question and also to see a diagram of how the components of a
PICOT research question can be "mapped" onto that respective test.
At least five (5) observations in each cell of a cross-tabulation table
Comparing two independent groups
Categorical outcome
Report cross-tabulation table with frequencies and percentages, calculate unadjusted
odds ratio with 95% confidence interval
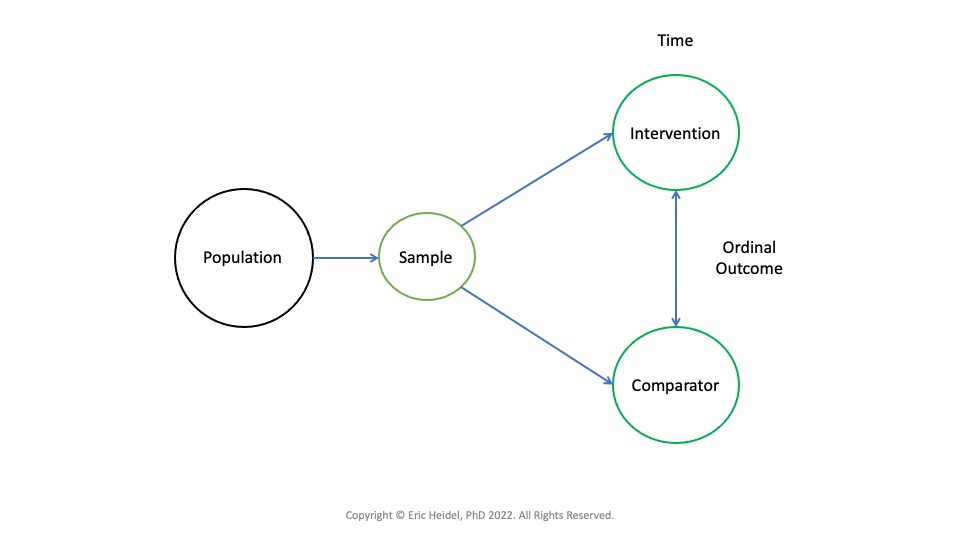
PICOT Research Question and Mann-Whitney U
Comparing two independent groups
Ordinal outcome
Used when statistical assumptions are violated for independent samples t-test
Report medians and interquartile ranges for each independent group
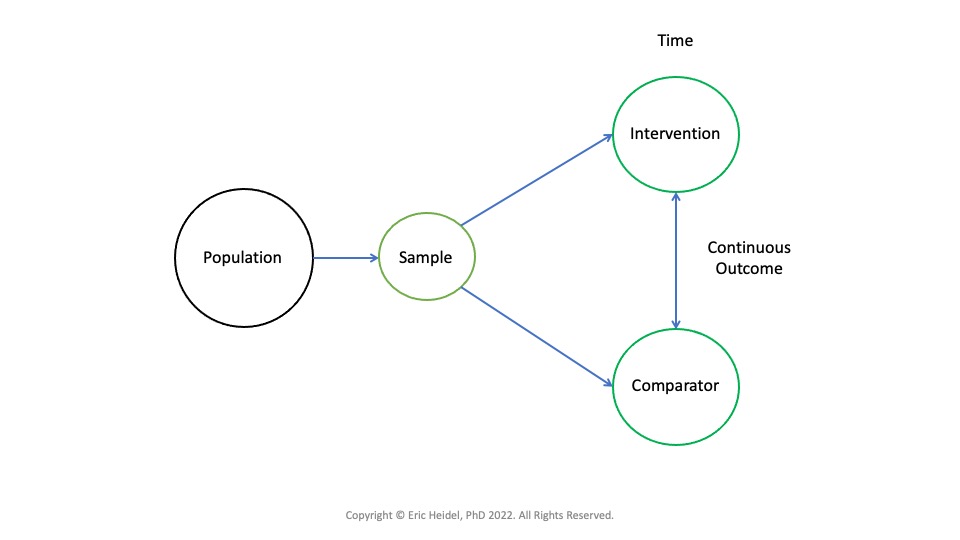
PICOT Research Question and Independent Samples t-test
Assumption of independence of observations (participants are only observed once and only in one group)
Assumption of normality (Kolmogorov-Smirnov, Shapiro-Wilk, skewness and kurtosis)
Assumption of homogeneity of variance (Levene's test of Equality of Variances)
Comparing two independent groups
Continuous outcome
Report means and standard deviations for each independent group
PICOT Question and Linear-by-Linear Association
Comparing three or more groups
Categorical outcome
Report cross-tabulation table with frequencies and percentages
Choose a reference category/group and calculate unadjusted odds ratios and 95% confidence
intervals against all remaining categories/groups
PICOT Research Question and Kruskal-Wallis
Comparing three or more groups
Ordinal outcome
Significant main effect leads to post hoc testing using Dunn's test
Used when statistical assumptions are violated for ANOVA
Report medians and interquartile ranges for each independent group
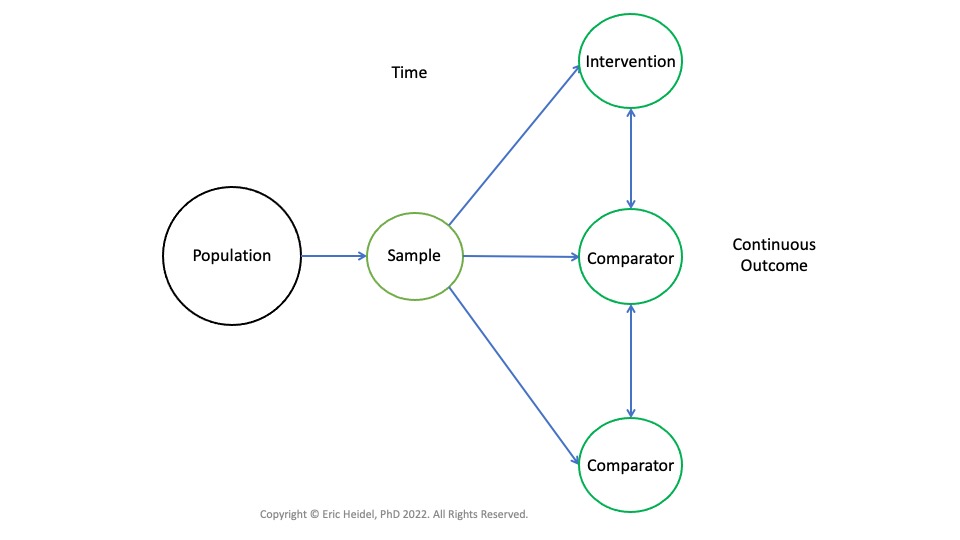
PICOT Research Question and ANOVA
Assumption of independence of observations (participants are only observed once and only in one group)
Assumption of normality (Kolmogorov-Smirnov, Shapiro-Wilk, skewness and kurtosis)
Assumption of homogeneity of variance (Levene's test of Equality of Variances)
Comparing three or more groups
Continuous outcome
Significant main effect leads to post hoc testing using one of several tests (Tukey's HSD,
Scheffe's, Bonferroni, etc.)
Report means and standard deviations for each independent group
PICOT Research Question and McNemar's Test
Assess change across two observations
Categorical outcome
Calculate and report unadjusted odds ratio with 95% confidence interval
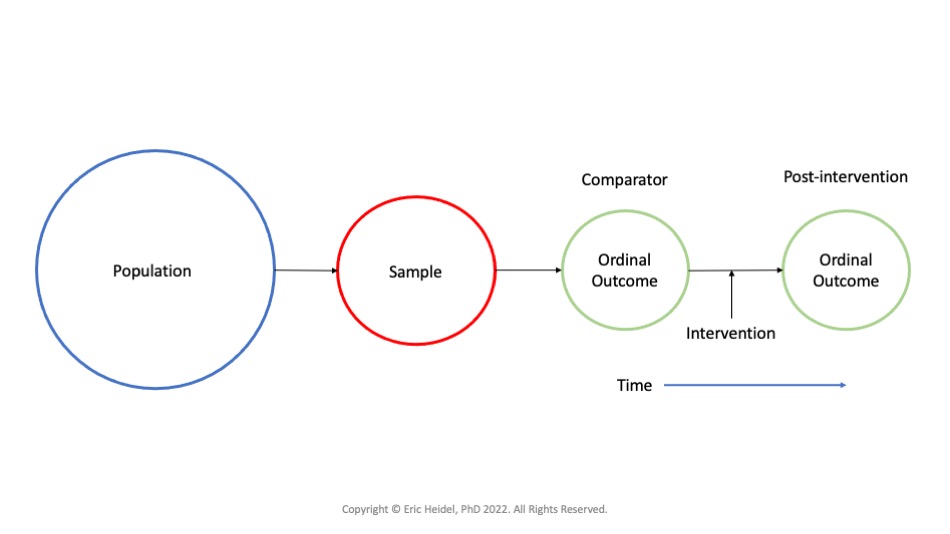
PICOT Research Question and Wilcoxon Signed Ranks Test
Assess change across two observations
Ordinal outcome
Used when statistical assumptions are violated for repeated-measures t-test
Report medians and interquartile ranges for each observation
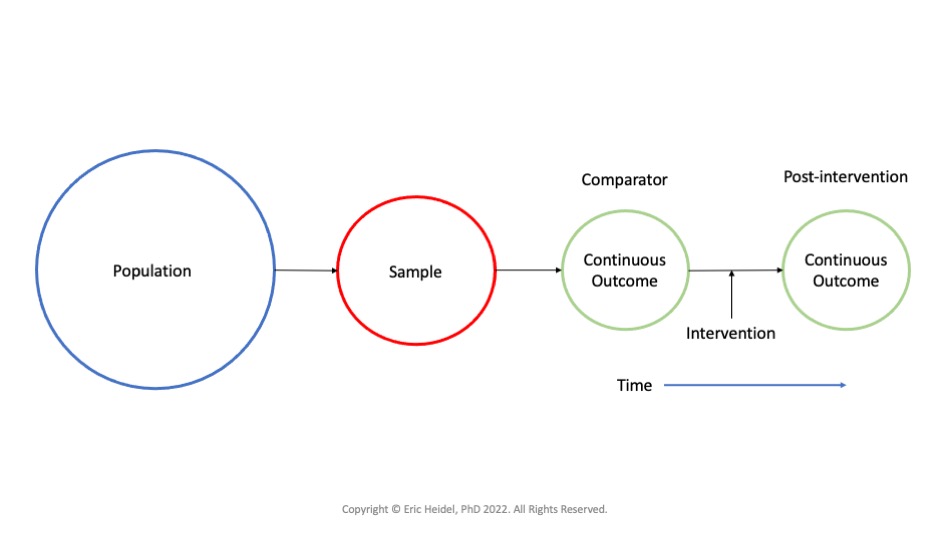
PICOT Research Question and Repeated-Measures t-test
Assumption of normality (Kolmogorov-Smirnov, Shapiro-Wilk, skewness and kurtosis) for each observation
Assess change across two observations
Continuous outcome
Report means and standard deviations for each observation
PICOT Research Question and Cochran's Q Test
Assess change across three or more observations
Categorical outcome
Calculate and report unadjusted odds ratio with 95% confidence interval
PICOT Research Question and Friedman's ANOVA
Assess change across three or more observations
Ordinal outcome
Used when statistical assumptions are violated for repeated-measures ANOVA
Significant main effect leads to post hoc testing (Nemenyi test)
Report medians and interquartile ranges for all observations
PICOT Research Question and Repeated-Measures ANOVA
Assumption of normality (Kolmogorov-Smirnov, Shapiro-Wilk, skewness and kurtosis) for each observation
Assumption of sphericity (Mauchly's Test of Sphericity)
Greenhouse-Geisser correction used when sphericity is violated
Assess change across three or more observations
Continuous outcome
Significant main effect leads to post hoc testing using one of several tests (Tukey's HSD,
Scheffe's, Bonferroni, etc.)
Report means and standard deviations for each observation
PICOT Research Question and Phi-Coefficient
Correlation between two categorical outcomes
Report the correlation coefficient and p-value
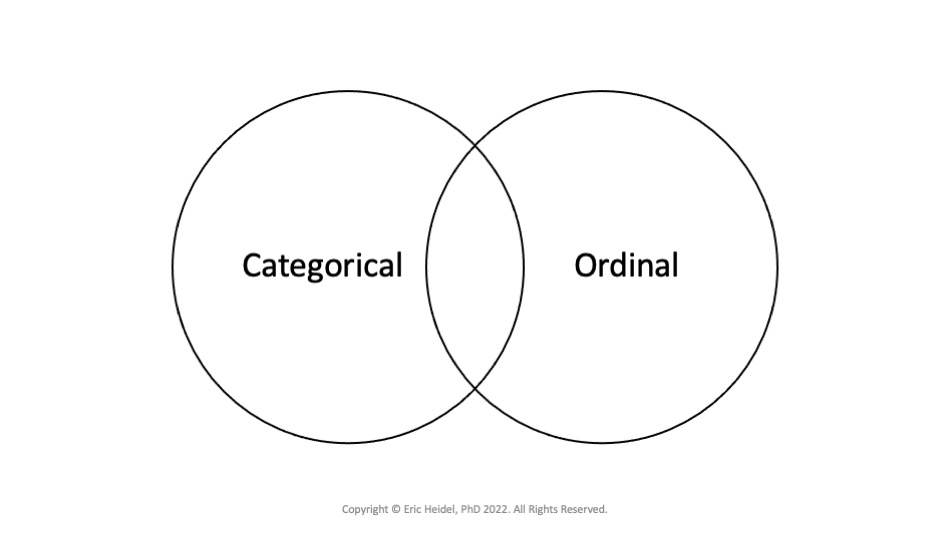
PICOT Research Question and Rank Biserial Correlation
Correlation between an ordinal outcome and a categorical outcome
Report the correlation coefficient and p-value
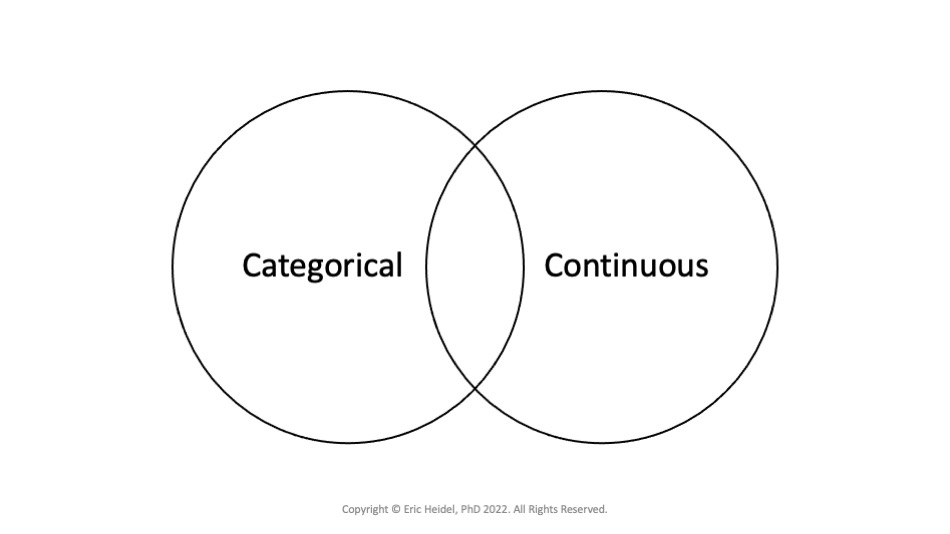
PICOT Research Question and Point Biserial Correlation
Assumption of normality (Kolmogorov-Smirnov, Shapiro-Wilk, skewness and kurtosis) met
for the continuous outcome
Correlation between a continuous outcome and a categorical outcome
Report the correlation coefficient and p-value
PICOT Research Question and Spearman Correlation
Correlation between two ordinal outcomes
Report the correlation coefficient and p-value
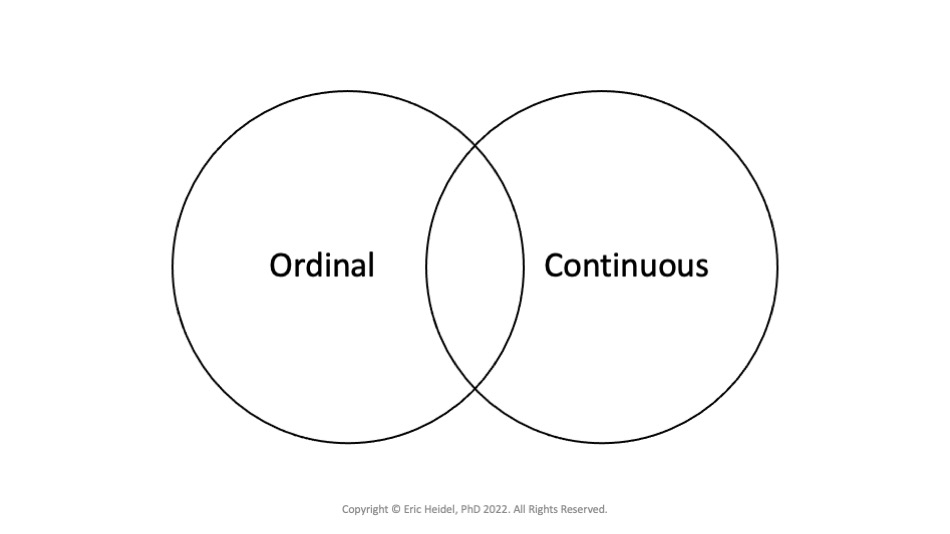
PICOT Research Question and Kendall's tau-b Correlation
Assumption of normality (Kolmogorov-Smirnov, Shapiro-Wilk, skewness and kurtosis) met
for the continuous outcome
Correlation between a continuous outcome and an ordinal outcome
Report the correlation coefficient and p-value
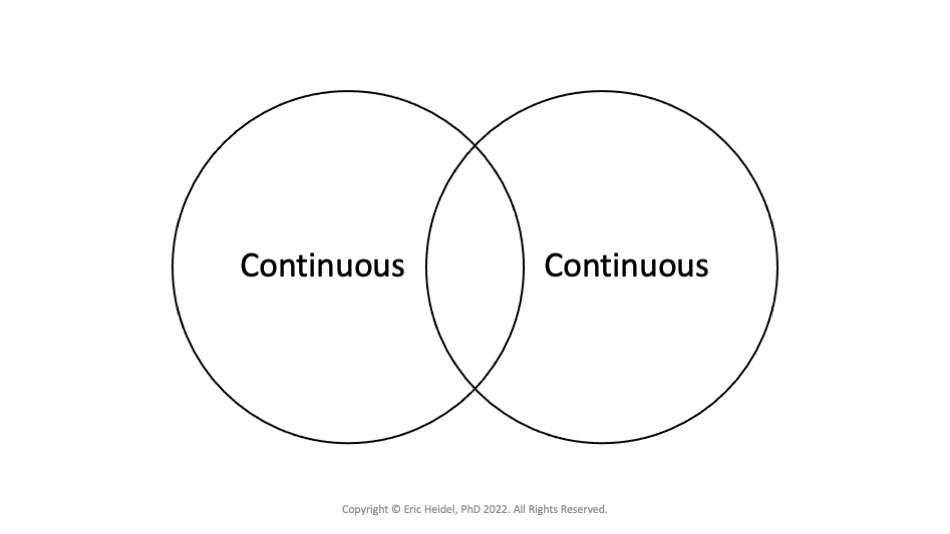
PICOT Research Question and Pearson Correlation
Assumption of normality (Kolmogorov-Smirnov, Shapiro-Wilk, skewness and kurtosis) met
for both continuous outcomes
Correlation between two continuous outcomes
Report the correlation coefficient and p-value
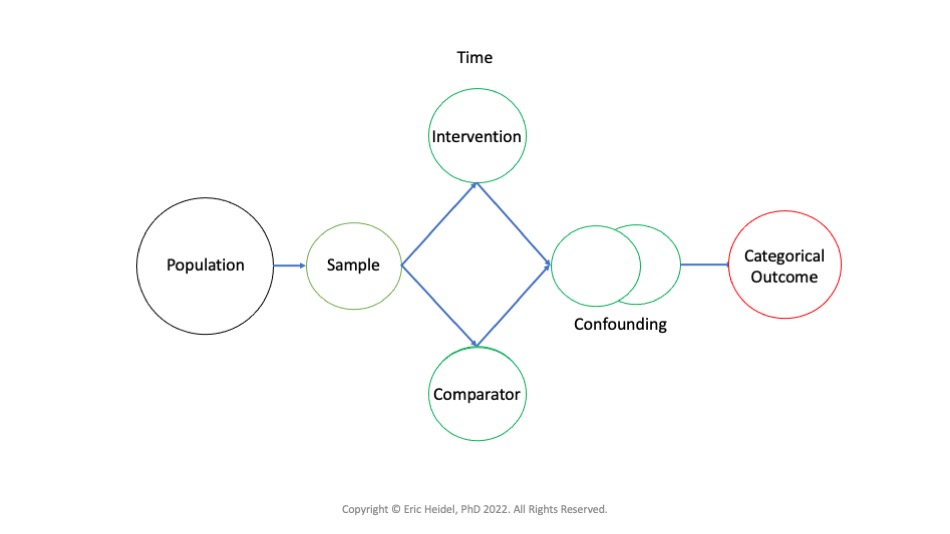
PICOT Research Question and Logistic Regression
Predicting for a binary categorical outcome
Independent, demographic, and confounding variables can be categorical, ordinal, or continuous
Independent, demographic, and confounding variables are entered into logistic regression model based
on relevant theoretical framework or previously peer-reviewed and published evidence
Report adjusted odds ratios with 95% confidence intervals
PICOT Research Question and Ordinal Logistic Regression
Predicting for an ordinal outcome
Independent, demographic, and confounding variables can be categorical, ordinal, or continuous
Independent, demographic, and confounding variables are entered into logistic regression model based
on relevant theoretical framework or previously peer-reviewed and published evidence
Report adjusted odds ratios with 95% confidence intervals
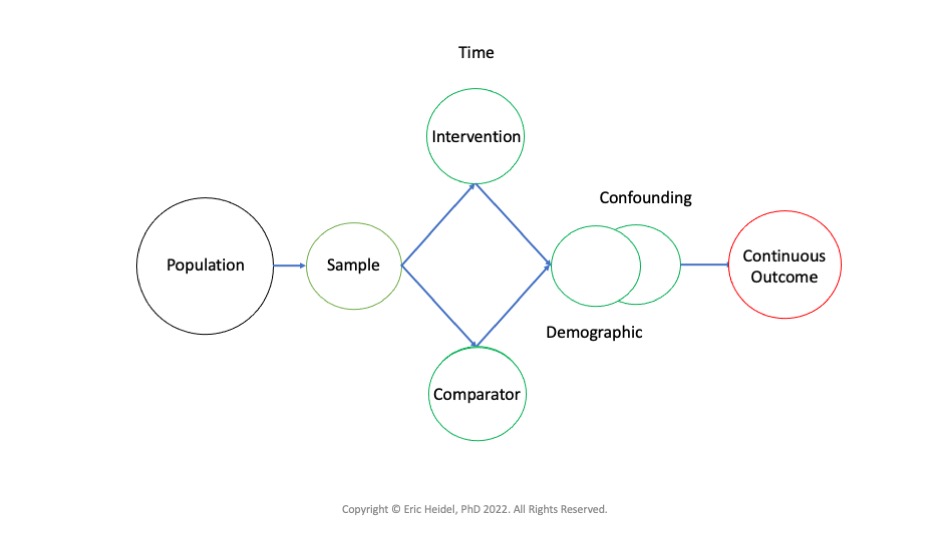
PICOT Research Question and Multiple Regression
Assumption of linearity (correlations and scatterplots)
Assumption of multicollinearity (Variance inflation factor [VIF] and tolerance statistics)
Assumption of autocorrelation (Durbin-Watson statistic)
Assumption of normality (residual analysis, histograms, Q-Q plot)
Assumption of homoscedasticity (plot of standardized residuals versus predicted values)
Independent, demographic, and confounding variables can be categorical, ordinal, or continuous
Independent, demographic, and confounding variables are entered into logistic regression model based
on relevant theoretical framework or previously peer-reviewed and published evidence
Predicting for a continuous outcome
Report unstandardized beta coefficients, their respective standard errors, standardized beta coefficients, and p-values
Report change in R2 (r-squared) or shared variance, along with the F-test results and p-value